


A company can carry debt for years without trouble, right up until it can’t. The interest coverage ratio is the fastest way to check whether a business earns enough to cover its interest payments. Lenders run this number before approving a loan. Bond investors check it before buying a company’s debt. Equity analysts watch it slip months before a downgrade or default becomes public. Once you know how to calculate the interest coverage ratio, you can spot financial strain long before the headlines catch up.
What Is the Interest Coverage Ratio?
The interest coverage ratio measures how many times a company’s operating earnings can cover its interest expense for a given period. It answers one specific question. If the business stopped growing today, could it still afford the interest on its debt using only what it earns from operations?
This ratio does not measure whether a company can pay off its debt. It only measures whether the business earns enough to service the interest portion of that debt. That distinction matters, because a company can post a strong interest coverage ratio while still carrying an unsustainable amount of principal.
Analysts sometimes call this the times interest earned ratio. You will see both names used interchangeably in credit reports and loan agreements.
Interest Coverage Ratio Formula
The Standard EBIT Formula
The most common version of the formula is:
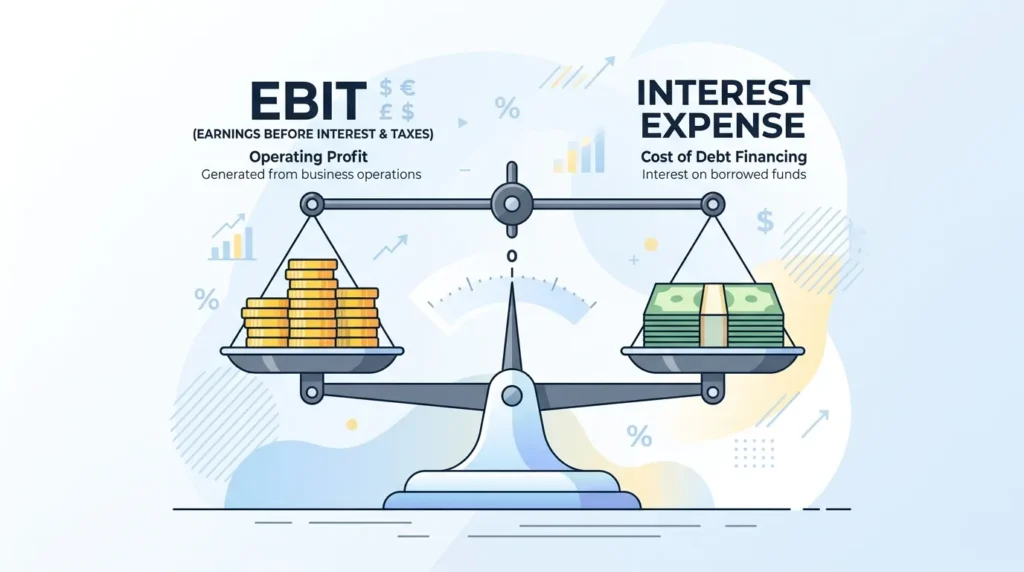
Interest Coverage Ratio = EBIT / Interest Expense
EBIT stands for earnings before interest and taxes. You will find it on the income statement. You can also calculate it yourself by taking operating income and adding back any interest already expensed. Interest expense is the total cost of servicing all outstanding debt for the period, including bonds, term loans, and lines of credit.
The EBITDA Variation
Some analysts substitute EBITDA, which stands for earnings before interest, taxes, depreciation, and amortization, for EBIT:
Interest Coverage Ratio = EBITDA / Interest Expense
This version strips out non-cash charges like depreciation, which makes it useful for capital-intensive businesses such as manufacturers or telecom providers. In those industries, large depreciation expenses can make EBIT look weaker than the company’s actual cash position suggests. The tradeoff is that EBITDA can overstate real ability to pay. Depreciation exists for a reason: equipment eventually needs replacing, and replacement takes cash.
How to Calculate Interest Coverage Ratio: A Step-by-Step Example
Say a company reports the following for the year:
- Revenue: $4,200,000
- Operating expenses, excluding interest and taxes: $3,100,000
- Interest expense: $275,000
First, calculate EBIT:
EBIT = $4,200,000 minus $3,100,000 = $1,100,000
Then divide EBIT by interest expense:
Interest Coverage Ratio = $1,100,000 / $275,000 = 4.0x
This company earns four times what it needs to cover its annual interest payments. If interest expense doubled to $550,000 because of new debt or a jump in variable rates, the ratio would fall to 2.0x. That is still workable, but far less comfortable. This ratio is only as reliable as the bookkeeping behind it, which starts with the accounts a business runs its cash through in the first place.
Common Mistakes When Calculating This Ratio
A few errors show up often, even among people who understand the formula. The first is mixing up EBIT and EBITDA without noting which one was used. That mistake makes the resulting ratio impossible to compare against a benchmark built on the other measure. The second is using only cash interest paid instead of total interest expense. This understates the true obligation if a company has capitalized or deferred any interest.
A third mistake is calculating the ratio from a single quarter and treating it as the full-year picture. Seasonal businesses can look strong in one quarter and weak in another, so a trailing twelve-month figure gives a more honest read. Always check whether the interest expense figure includes all debt instruments, not just the largest loan on the books.
What Counts as a Good Interest Coverage Ratio
There is no single number that applies to every company. As a general rule, a ratio below 1.5x raises concern among lenders. It leaves little room for a weak quarter before interest payments become hard to meet. A ratio between 2.0x and 3.0x is typically considered stable for most established companies. Anything above 3.0x usually signals a comfortable cushion. An unusually high ratio, say above 10x, can also mean a company is under-leveraged and not using debt efficiently to fund growth.
Why the Ratio Varies by Industry
A software company with minimal debt and high margins might post a ratio above 15x without much effort. A utility or an airline, both reliant on heavy fixed-asset financing, might run at 2x to 3x even when financially healthy. Before judging a single ratio as good or bad, compare it against direct competitors in the same industry. A universal benchmark rarely tells the full story.

What a Low or Negative Interest Coverage Ratio Means
A ratio under 1.0x means operating earnings do not even cover interest expense for the year. That gap has to be filled somehow, usually through cash reserves, asset sales, or more borrowing. None of those options holds up for long. A negative interest coverage ratio, which happens when EBIT itself is negative, is a more serious warning sign. It means the core business is losing money before interest even enters the picture.
Neither situation guarantees bankruptcy on its own. A young company burning cash while it scales can post a weak ratio for a period and still recover once operations stabilize. The same is true for a business absorbing a one-time expense. Context matters as much as the number itself. Check whether the weak ratio is a single bad quarter or a multi-year trend before drawing conclusions.
Interest Coverage Ratio vs Other Debt Ratios
Interest Coverage Ratio vs Debt Service Coverage Ratio
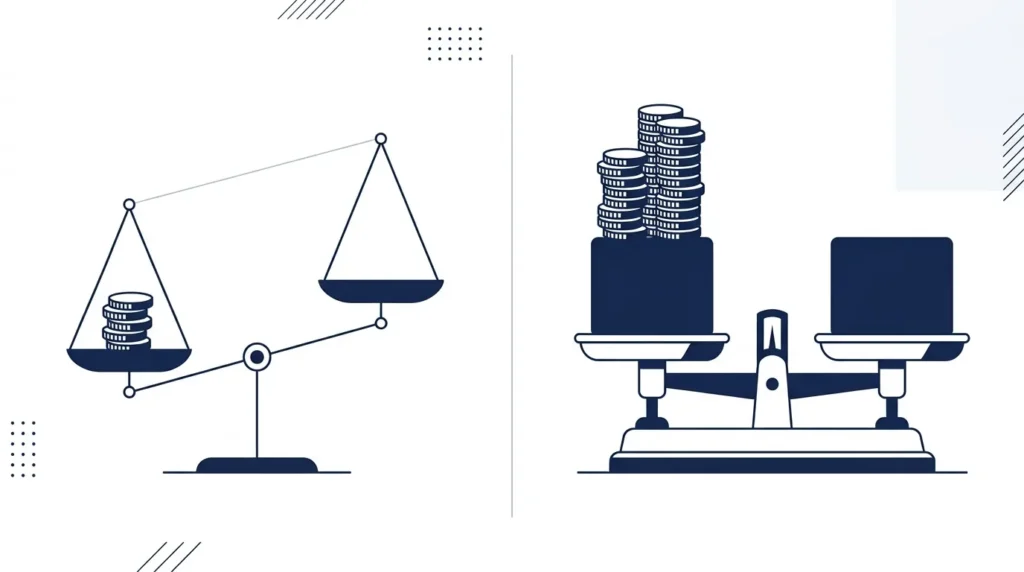
The debt service coverage ratio goes a step further than interest coverage. Instead of measuring only interest, it checks whether operating income covers both interest and scheduled principal repayment. A company can show a healthy interest coverage ratio while still failing the debt service test. This happens when large principal payments are coming due soon. Lenders often check both figures, since interest coverage alone does not capture near-term repayment pressure.
Interest Coverage Ratio vs Debt-to-EBITDA
Debt-to-EBITDA measures how many years of earnings it would take to pay off total debt. Interest coverage measures whether current earnings can service the interest on that debt right now. A company can carry a high debt-to-EBITDA ratio and still maintain a strong interest coverage ratio. That combination is possible when it locked in low fixed interest rates years earlier. The two ratios answer different questions and work best when read together.
Limitations of the Interest Coverage Ratio
The interest coverage ratio has real blind spots. It is based on accounting earnings, not cash flow. A company can look solvent on paper while struggling to generate actual cash. It ignores principal repayment entirely, so a company with interest-only debt can look healthier than one making regular principal payments. That’s true even if the second company is in better long-term shape. It also skips capital expenditures. A business plowing cash into new equipment might show a strong ratio while its free cash flow tells a tighter story.
One-time items can distort the ratio too. A large asset sale, an insurance payout, or a legal settlement can inflate EBIT for a single quarter. None of that reflects the underlying business. Always check whether the earnings behind the ratio came from core operations or from something unlikely to repeat.
How to Improve Interest Coverage Ratio
Two levers move this ratio: earnings and interest expense. On the earnings side, companies raise operating income by cutting costs, improving margins, or growing revenue faster than expenses. On the debt side, a few moves help directly. Refinancing existing loans at a lower rate reduces the interest bill immediately. Paying down principal ahead of schedule shrinks future interest charges. Delaying a large purchase instead of financing it keeps new debt off the books entirely.
Timing plays a role too. Companies with variable-rate debt should watch their interest coverage ratio closely when rates rise. The interest expense side of the equation can move even when operating income stays flat. Locking in fixed-rate debt during low-rate periods is a common way businesses protect their coverage ratio from future rate swings.
Who Uses the Interest Coverage Ratio and Why
Banks and other lenders use this ratio as a loan covenant. The borrower must keep the ratio above an agreed threshold or risk default on the loan terms. Bond investors use it to judge credit risk before buying corporate debt, since a weakening ratio often precedes a rating downgrade. Equity investors use it as an early warning sign. It helps them check whether a company’s growth is funded by earnings or by debt that is getting harder to service.
Even outside public markets, the same math applies. A small business loan application, a franchise purchase, or even a personal debt decision all rely on the same basic logic. Each one asks how much debt is manageable relative to income. Checking this ratio once is not enough, since earnings and interest expense both shift from quarter to quarter. Track it over several periods rather than relying on a single snapshot to judge financial health.

