

The business cycle describes the natural rise and fall of economic activity over time. In the United States, this pattern shapes hiring decisions, interest rates, stock prices, and even how much confidence people feel about spending money. Understanding where the economy sits in this cycle helps business owners plan inventory, helps investors adjust portfolios, and helps everyday workers anticipate what a shift in the job market might mean for them.
Unlike a fixed calendar event, the business cycle has no set length. Some expansions last a decade, while others end within two years. What stays consistent is the sequence itself: expansion, peak, contraction, and trough, followed by a new expansion. This article breaks down each phase, explains how economists identify them, and shows what typically happens to businesses, workers, and markets at each stage.
What Is the Business Cycle
The business cycle refers to the recurring pattern of growth and decline in a country’s overall economic output, usually measured through gross domestic product, employment levels, and industrial production. It is not a prediction of exact timing. It is a framework economists use to describe how economies naturally move through periods of growth and slowdown.
In the US, the organization most responsible for officially marking these phases is the National Bureau of Economic Research. Its Business Cycle Dating Committee reviews a mix of data, including employment figures, personal income, and industrial output, before declaring when a recession has started or ended. This process often happens months after the actual turning point, since it takes time to confirm a genuine trend rather than a temporary dip.
The Four Main Phases of the Business Cycle
Every business cycle moves through four distinct phases. Each one has its own characteristics, and recognizing them helps explain shifts in hiring, consumer spending, and investment behavior.
1. Expansion
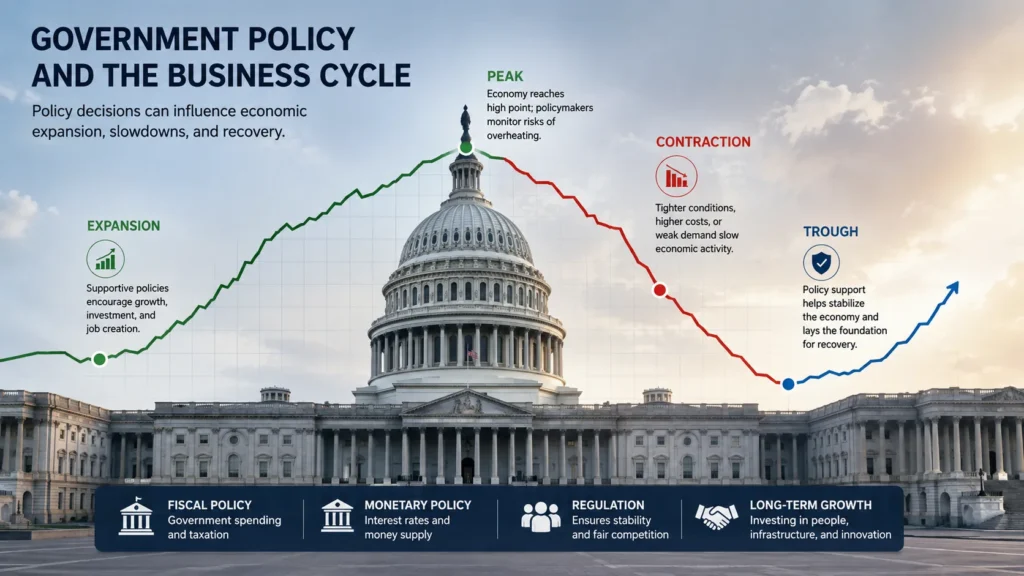
Expansion is the growth phase. Output rises, unemployment falls, wages tend to increase, and consumer confidence builds. Businesses often expand production, take on new hires, and invest in equipment or new locations during this period. Retail sales climb, and credit becomes easier to access as banks compete for borrowers.
Expansions are usually the longest phase of the cycle. In the US, the expansion following the 2009 recession lasted more than a decade, making it the longest on record before the 2020 downturn interrupted it. Not every expansion runs that long, but the pattern of steady, broad-based growth is the defining feature of this phase.
2. Peak
The peak marks the top of the cycle, where economic activity reaches its highest point before beginning to slow. At this stage, growth often becomes harder to sustain. Prices may rise faster than wages, labor markets tighten to the point where employers struggle to find qualified workers, and interest rates are frequently higher after a prolonged expansion.
A peak is rarely obvious while it is happening. Economists typically identify a peak only in hindsight, once data confirms that output has started declining rather than simply pausing.
3. Contraction (Recession)
Contraction is the phase most people associate with economic hardship. Output falls, unemployment rises, and business investment slows or reverses. Consumer spending typically pulls back as households grow cautious about job security and future income.
A recession is commonly defined as two consecutive quarters of declining GDP, though the NBER uses a broader set of indicators rather than relying on that rule alone. Contractions vary widely in severity. Some, like the 2001 downturn, were relatively mild. Others, like the 2008 financial crisis, caused serious and lasting damage across multiple industries.
4. Trough
The trough is the low point of the cycle, where economic activity bottoms out before a new expansion begins. Unemployment is typically at its highest, and business confidence is at its lowest. This phase can feel indistinguishable from contraction while it is happening, since the turning point is only clear once growth resumes.

Troughs often set the stage for the next expansion. Lower interest rates, reduced costs, and pent-up consumer demand frequently combine to spark renewed spending and investment once conditions stabilize.
How Economists and the NBER Define These Phases
The NBER does not rely on a single statistic to date the business cycle. Instead, its committee reviews multiple indicators together, including nonfarm payroll employment, real personal income minus transfers, industrial production, and real manufacturing and trade sales. This layered approach helps avoid false signals from a single volatile data point.
Because the committee waits for confirmation across several data series, official recession announcements often arrive well after a downturn has already begun. This lag frustrates people looking for real-time answers, but it protects against prematurely labeling a temporary slowdown as a full recession.
What Drives Movement Between Phases
Several forces push the economy from one phase to the next. Interest rate policy set by the Federal Reserve plays a major role, since borrowing costs directly influence business investment and consumer spending. When rates rise to control inflation, growth tends to slow, which can push the economy from peak toward contraction.
Consumer confidence also matters significantly. When households feel secure about their jobs and income, they spend more freely, which fuels expansion. When confidence drops, whether from job losses, market volatility, or global events, spending pulls back and growth slows.
External shocks can accelerate or trigger phase changes outside of normal patterns. The 2020 recession, driven by pandemic-related shutdowns, moved the economy from expansion to contraction within weeks rather than the gradual shift typically seen in prior cycles. Supply chain disruptions, energy price spikes, and geopolitical events can similarly compress or extend a phase .Knowing which phase the economy is in also explains how dividend-paying stocks tend to hold up when growth slow.
How Long Does Each Phase Typically Last in the US
Since 1945, US expansions have averaged around five years, though recent decades have trended longer. Contractions have historically been shorter, averaging roughly eleven months, based on NBER records. These averages should be treated as historical context rather than a forecasting tool, since individual cycles vary considerably based on the underlying causes of the downturn or the strength of the preceding expansion.
The 1980s saw two relatively short recessions close together, while the expansion of the 1990s ran for nearly a decade without interruption. This variability is precisely why economists avoid predicting exact cycle lengths and instead focus on monitoring current indicators.
How the Business Cycle Affects Businesses and Investors
Different phases call for different strategies. Businesses and investors who adjust their approach based on the current phase tend to manage risk more effectively than those who treat every period the same way.
1. Expansion Phase Strategy
During expansion, businesses often focus on growth, including hiring, expanding product lines, and entering new markets. Investors frequently favor growth-oriented stocks and sectors tied to consumer spending, such as retail and travel, since rising confidence tends to support these industries.
2. Peak Phase Strategy
Near a peak, businesses often shift toward caution, watching costs closely and avoiding overextension through debt. Investors may begin rebalancing portfolios toward more defensive sectors, such as utilities or consumer staples, which tend to hold up better when growth slows.
3. Contraction Phase Strategy
During contraction, businesses typically prioritize cost control, cash reserves, and protecting core operations rather than pursuing aggressive expansion. Investors often favor bonds or defensive equities, since these tend to be less sensitive to falling consumer spending than cyclical sectors like manufacturing or luxury goods.
4. Trough Phase Strategy
At the trough, opportunities often emerge for those positioned to act early. Businesses with strong cash reserves may find favorable pricing on equipment, real estate, or acquisitions. Investors sometimes view this phase as a point to consider re-entering growth-oriented assets, though timing the exact bottom is notoriously difficult even for experienced professionals.
Business Cycle vs Long-Term Economic Growth Trend
It helps to separate the business cycle from the long-term growth trend of an economy. The trend line represents an economy’s overall capacity to produce goods and services over decades, driven by factors like population growth, productivity improvements, and technological change. The business cycle represents short-term fluctuations around that trend line.
An economy can experience a recession while still maintaining a positive long-term trend, just as it can experience a strong expansion that temporarily pushes output above its sustainable long-term capacity. Recognizing this distinction prevents confusion between short-term volatility and an economy’s underlying structural health.
Common Misconceptions About the Business Cycle
One common misunderstanding is that a recession always means a severe crisis. In reality, contractions vary widely in depth and length, and many recessions in US history caused only moderate disruption compared to major events like 2008.
Another misconception is that the stock market and the business cycle always move in perfect sync. Markets are forward-looking and often begin declining before an official recession starts, or begin recovering before a trough is confirmed. This is why stock performance and GDP data can appear disconnected in the short term.
Some also assume every expansion must end in a severe downturn. While all expansions eventually slow, the size and severity of the following contraction depends heavily on the causes behind it, ranging from routine cooling after overheating growth to shocks from external crises.