


The average homeowners insurance cost in the U.S. is about $2,490 a year, or roughly $208 a month, for a policy with $400,000 in dwelling coverage. That figure comes from NerdWallet’s 2026 rate analysis of more than 100 insurance companies across all 50 states. Your own bill could land well above or below that number, since location, home size, and credit history all move the price.
Homeowners shopping for a first policy, or renewing one that just went up, usually want the same thing: a realistic sense of what’s normal before they start comparing quotes from companies like the ones listed on comparison sites such as NerdWallet, or before requesting coverage through a provider such as American Express’s homeowners insurance marketplace. The numbers below break that average down by state, city, insurer, and coverage level, along with the specific factors that push an individual quote above or below the national figure.
What the National Average Actually Covers
The $2,490 figure is a benchmark, not a quote. It assumes a 40-year-old homeowner with good credit, a two-story single-family home built in 1984, a $1,000 deductible, and coverage that includes $400,000 in dwelling protection, $300,000 in liability, and $80,000 for loss of use.
Change any one of those details and the number moves. A smaller or newer home usually costs less to insure. A house in a wildfire or hurricane zone usually costs more, sometimes by a wide margin.
Average Homeowners Insurance Cost by State
Where you live has more influence on your premium than almost anything else. Weather exposure and state insurance regulation both play a part.
These states currently carry the highest average premiums:
| State | Average Annual Cost |
| Oklahoma | $7,255 |
| Nebraska | $6,015 |
| Kansas | $5,455 |
| Arkansas | $4,955 |
| Texas | $4,915 |
These states carry the lowest average premiums:
| State | Average Annual Cost |
| Hawaii | $900 |
| Vermont | $1,170 |
| Delaware | $1,365 |
| Alaska | $1,385 |
| New Jersey | $1,480 |
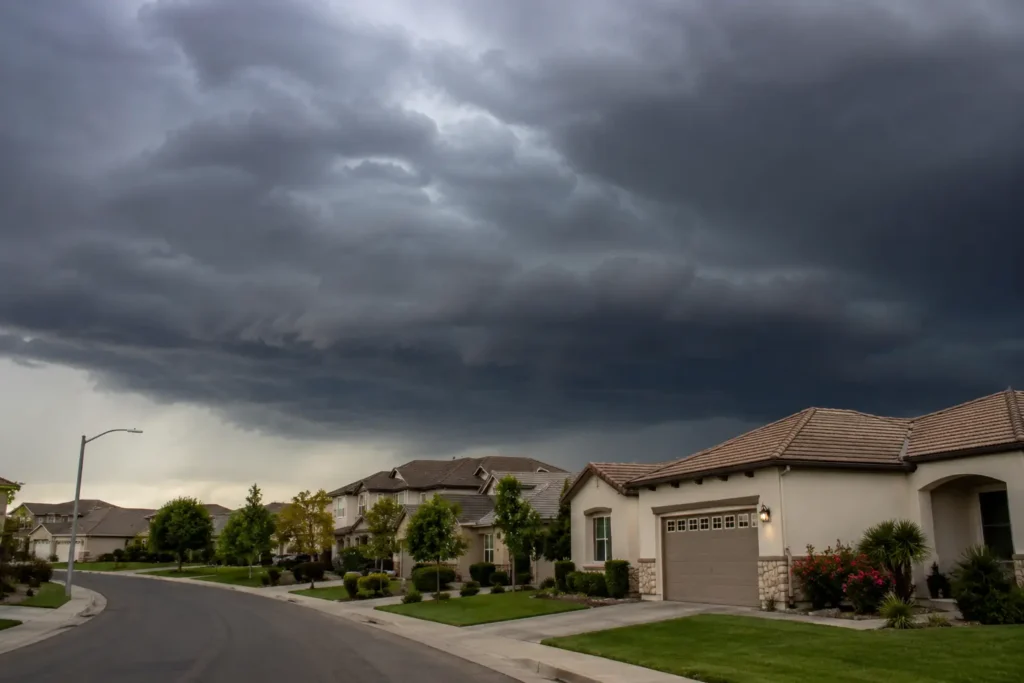
Tornado and hail exposure across the central U.S. helps explain why Oklahoma, Nebraska, and Kansas sit at the top. Hawaii’s low average is partly a technicality: standard policies there exclude hurricane wind damage, so homeowners buy that coverage as a separate add-on rather than folding it into the base premium.
State regulation matters too. Insurers can raise rates more freely in some states than others, which widens the gap between neighboring regions even when storm risk is similar.
How Insurance Costs Differ by City
City-level data tells a similar story to the state data, just at finer resolution. Oklahoma City averages around $9,770 a year, and Houston and Fort Worth aren’t far behind, all shaped by tornado and hurricane exposure.
On the other end, homeowners in San Jose, Seattle, and San Francisco pay some of the lowest averages in the country, often under $1,800 a year. Lower storm risk and, in some cases, state rules that limit how insurers price policies both help keep those numbers down.
Crime rates and local rebuilding costs also shift city averages. A dense urban area with a higher cost of construction labor can push premiums up even where weather risk is moderate.
Average Cost by Insurance Company
Rates vary by carrier as much as they do by geography. Among large, widely available insurers, State Farm currently offers the lowest average annual rate, at roughly $2,415. Travelers and Allstate sit close behind.
USAA prices are even lower, around $1,940 a year on average, but membership is limited to military members, veterans, and some federal employees and their families. Smaller regional insurers can sometimes beat all of these figures in a specific ZIP code, which is one reason comparing multiple quotes matters more than chasing a single “cheapest” brand name.
How Dwelling Coverage Amount Changes Your Premium
Dwelling coverage, the part of your policy that pays to rebuild your home, is the single biggest lever on price. It should reflect what it would actually cost to rebuild your house, not what you paid for it or what it’s worth on the market.
| Dwelling Coverage | Average Annual Cost |
| $200,000 | $1,480 |
| $300,000 | $1,975 |
| $400,000 | $2,490 |
| $500,000 | $3,005 |
| $600,000 | $3,510 |
| $700,000 | $3,995 |
| $800,000 | $4,445 |
Each jump of $100,000 in coverage adds roughly $500 to the annual premium in this data set. Underinsuring to save money is a real risk here, since a shortfall only shows up after a major loss, when it’s too late to fix.
Home Age, Deductible, Claims, and Credit
1. Home Age
Older homes typically cost more to insure than new construction. A sample house built in 1984 averaged $2,490 a year, while the same coverage on a home built in 2025 averaged $1,425. Newer homes tend to have updated wiring, plumbing, and roofing, all of which lower the odds of a costly claim.
2. Deductible
Raising your deductible from $1,000 to $2,500 cut the average premium by about 9% in NerdWallet’s analysis. That trade-off only makes sense if you have enough set aside to cover the higher out-of-pocket cost when you file a claim.
3. Claims History
Filing even one prior claim, such as for wind damage, pushed the average rate up by about 10%. Insurers treat claims history as a signal of future risk, similar to how a driving record affects auto insurance.
4. Credit Score
Credit-based insurance scores had the largest single effect in the data: homeowners with poor credit paid about 72% more than those with good credit. California, Maryland, and Massachusetts don’t allow insurers to use credit when setting homeowners, renters, condo, or mobile home rates, so this factor doesn’t apply to residents of those states.
Other Details That Quietly Affect Your Rate
Beyond location, coverage amount, and credit, a handful of smaller details shape the final number on your bill.
Your immediate neighborhood matters on its own. Living close to a fire station or fire hydrant can lower your rate, while a neighborhood with a higher crime rate can raise it, since theft and vandalism claims become more likely.

Extra features around the property carry their own price tag too. A swimming pool or trampoline raises liability risk, since an injury on the property could turn into a costly claim, and insurers price that risk into the premium. Dog ownership can factor in as well. Some insurers charge more for animal liability coverage, and a few decline to cover certain breeds or dogs with a history of aggressive behavior.
None of these factors move the needle as much as your ZIP code or your dwelling coverage limit, but they add up. A homeowner comparing quotes should expect small differences from carrier to carrier even on an otherwise identical property.
Why Premiums Keep Climbing
Rising costs aren’t just a perception. About a third of American homeowners with insurance, 34%, reported a premium increase in the past year, according to a 2026 NerdWallet survey. Construction material and labor costs have gone up, which raises the cost of rebuilding a home after a claim even when the home itself hasn’t changed.
Natural disasters are a large part of the pressure too. The National Oceanic and Atmospheric Administration recorded 27 separate weather and climate disasters in 2024 that each caused at least $1 billion in damage, the most recent year with complete data. In the same NerdWallet survey, 21% of homeowners said severe weather has directly affected rates in their area, with wildfire risk in the West, hail in the Midwest, and hurricanes in the Southeast named most often.
How to Bring Your Premium Down
A few practical steps consistently lower what homeowners pay, based on the rate patterns above.
Shopping around every year or two, comparing at least three insurers with matching coverage limits, is the single most reliable way to find savings. An independent agent can run these comparisons for homeowners who don’t want to do it themselves.
Bundling home and auto policies with the same insurer often unlocks a discount that isn’t available to standalone home policies. Asking directly about claims-free discounts, smart-home device discounts, and paying annually instead of monthly can also shave money off the bill.
Home upgrades matter too. A new roof, especially one rated for wind and hail resistance, can lower a premium on its own. Updated electrical and plumbing systems reduce fire and water-damage risk, which insurers factor into pricing.
Building credit over time, in states where credit affects home insurance pricing, is a slower lever but a meaningful one given the size of the gap between good and poor credit tiers in this data.